
Developer Offshore research
When is a database connection pool hiding saturation?
· Research report
Research on distinguishing healthy pooling from queued demand, leaked connections, and database saturation in an asynchronously managed application.
Use this report with the Research library and the related daily developer guides to turn evidence into a bounded work brief.
Key Stats
- 1 request path observed from caller to database
- 5 linked signals: demand, wait, use, rejection, and recovery
- 2 load shapes compared: steady traffic and a bounded burst
Key Takeaways
- Pool utilization without wait time can hide user delay.
- Increasing a pool can move contention into the database.
- The database owner retains authority over capacity and production limits.
The question begins at the queue
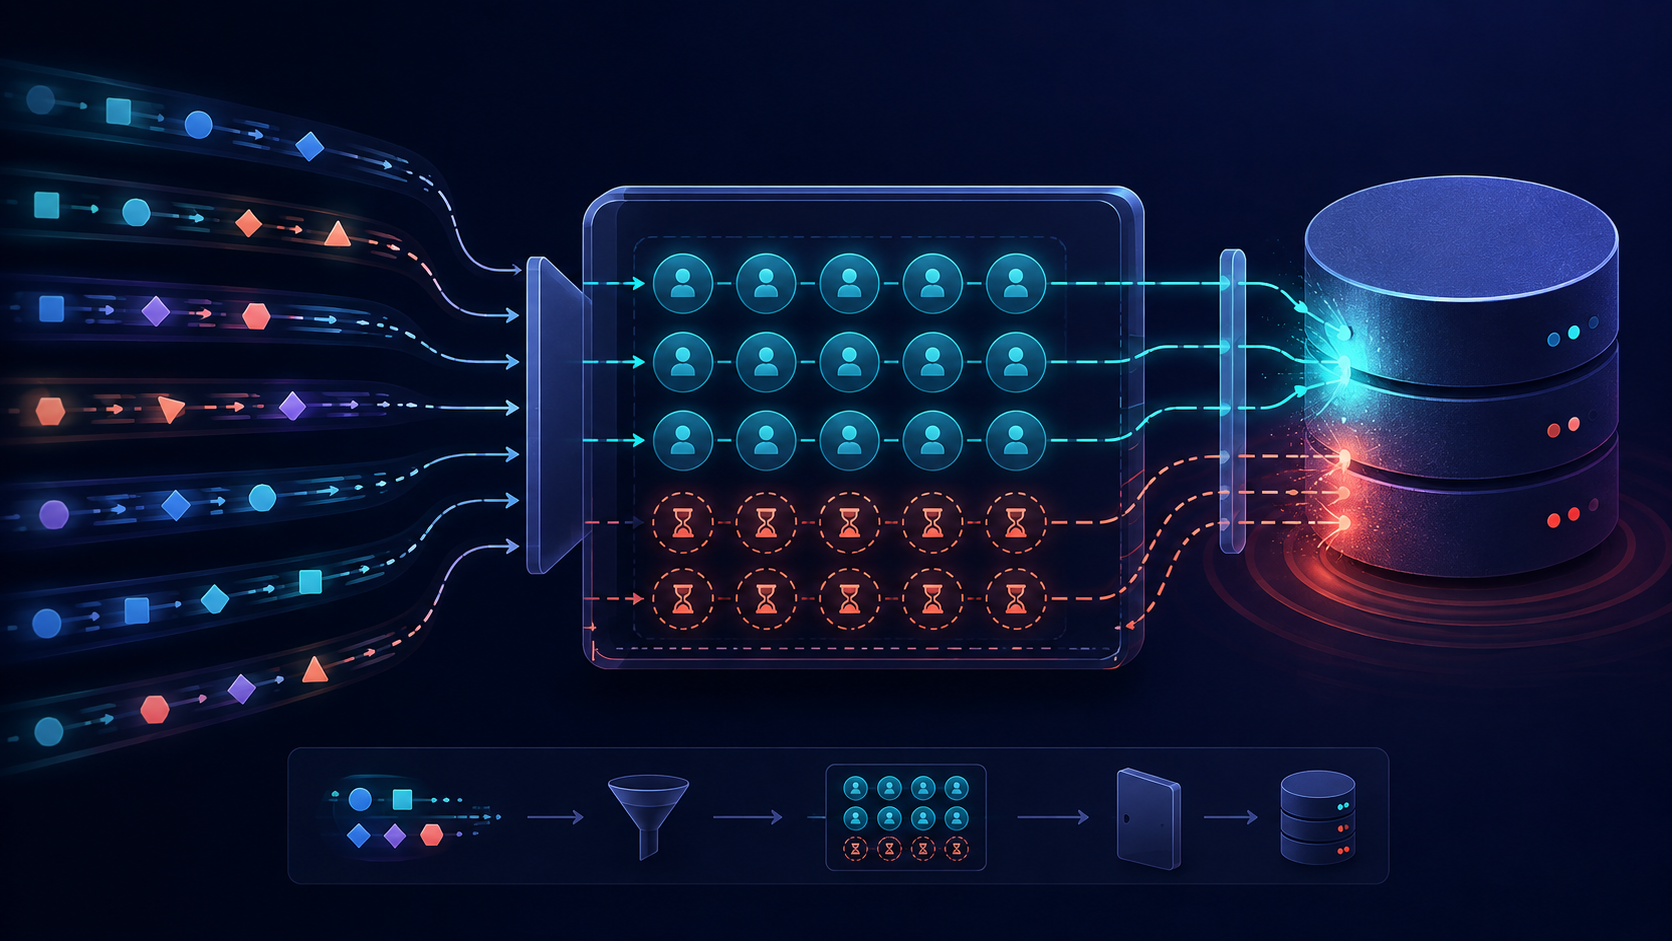
When does an application connection pool absorb harmless variation, and when does it conceal a database bottleneck until requests time out? The study follows one application request path handled by a distributed team. A Philippines-based developer may maintain the service and its pool settings, but the client-side database owner controls server capacity and production changes. We examine simultaneous demand, acquisition wait, checked-out duration, database activity, refusal, and recovery. A high pool utilization reading is not automatically a fault. A low reading is not automatically healthy if requests wait in another queue or abandon before acquiring a connection.
Measurement design
Create a baseline with a named application revision, database class, pool minimum and maximum, statement timeout, request deadline, and worker concurrency. Run a steady workload, then a bounded burst that resembles the service’s expected concurrency. Record arrival rate, pool wait distribution, connections in use and idle, acquisition failures, transaction duration, database sessions, lock waits, CPU, and completed user outcomes. Correlate these signals by interval and request identifier without logging secrets or personal data. Repeat after traffic stops to measure drain and recovery. The aim is causal comparison, not a maximum-throughput contest.
Facts supplied by documentation
PostgreSQL defines max_connections as the ceiling on concurrent server connections and reserves some slots for privileged roles. Its monitoring views expose current sessions and their states. Google SRE guidance treats overload as a condition requiring load control rather than unlimited queue growth. PgBouncer documentation distinguishes pooling modes whose transaction and session semantics differ. These are design facts. They cannot tell a team what pool size fits its queries, workload, database memory, or operational tolerance. The local claim must come from an observed request path and must state the tested configuration.
A pool can move the bottleneck
Suppose requests wait 400 milliseconds for a connection while database CPU remains moderate and transactions finish quickly. A larger application pool might reduce acquisition wait. Now suppose transaction time rises sharply as concurrent sessions increase and lock waits appear. Expanding the pool can admit more competing work and worsen completion time. Both cases may report that all configured connections are busy. The difference lies in the linked response of the database and the user outcome. Analysis should therefore compare slopes and recovery: what changed as concurrency increased, where waiting accumulated, and whether completed work improved.
Leak, long transaction, or legitimate work
Checked-out duration deserves a distribution, not a single average. A few slow analytical queries, an application path that forgets to release a connection, and a transaction blocked on a lock can produce similar pool occupancy. Collect representative traces that connect checkout, first statement, transaction boundaries, completion, and release. Then inject cancellation and error paths in a safe environment. If a cancelled request keeps its connection, the evidence suggests lifecycle failure. If the database shows an active long query, query design or workload policy may be the issue. If it shows idle in transaction, the transaction boundary requires review.
Decision boundaries for offshore delivery
The offshore developer can instrument acquisition wait, create a reproducible load fixture, identify code paths that retain connections, add timeout tests, and propose a reversible configuration change. They should not raise production max_connections, terminate sessions, alter database memory, or accept the resulting reliability risk without authorization. The database owner reviews server-wide effects because one application pool competes with maintenance, monitoring, migrations, and other services. The application owner decides user-facing deadlines and overload behavior. A handoff should name both decisions rather than presenting one larger number as the fix.
What would disprove the diagnosis
Try to falsify pool saturation as the cause. Measure upstream worker queues and downstream locks. Hold database work constant while varying application concurrency, then hold concurrency constant while varying query duration with safe fixtures. Check whether connection wait predicts request failure after accounting for the request’s remaining deadline. Confirm that metrics include every process and pool instance; per-instance dashboards can look calm while aggregate demand exceeds the database boundary. A diagnosis weakens if wait is rare, user outcomes do not change with pool settings, or another queue consumes most of the deadline.
Compare remedies against the same workload
A proposed remedy should rerun the same fixture and report the full signal set. Repairing a release leak may lower checked-out duration without changing the configured maximum. Capping worker concurrency may increase a short upstream queue while reducing database contention and improving completed outcomes. A query change may free connections sooner but introduce a different plan under another data distribution. Record confidence intervals only when the sample and method support them; otherwise publish the individual runs and their variation. The reviewer should prefer a change whose mechanism matches the diagnosis and whose rollback is clear. A better headline metric with worse request completion is counterevidence, not success.
Limits and conclusion
A synthetic load cannot reproduce every production query mix, network interruption, failover, maintenance job, or noisy neighbor. Short tests may miss gradual leaks. Metrics can add overhead and incomplete tracing can bias the sample toward successful requests. Within those limits, the evidence supports a pool change only when demand, acquisition wait, database response, user outcome, and recovery tell a coherent story. The safest conclusion may be to cap concurrency, shorten transactions, repair lifecycle code, or gather more observations. Capacity remains an internal owner decision; the developer’s contribution is a reproducible chain of evidence.
Evidence table
| Signal | What to inspect | Owner |
|---|---|---|
| Outcome | Acceptance evidence for the bounded task | Task reviewer |
| Control | Access, test, and approval boundary | Internal owner |
| Handoff | Open risks and next decision | Next owner |
Good distributed work is observable at the handoff: the result, evidence, limitations, and next owner are all explicit.
Frequently asked questions
Is a full connection pool always unhealthy?
No. It becomes concerning when linked evidence shows harmful wait, refusal, deadline loss, database contention, or poor recovery.
Who should change production connection limits?
The authorized database owner, after reviewing the application evidence and effects on every workload sharing the server.